Reporting
How to read Microsoft Advertising reports and what to optimize weekly
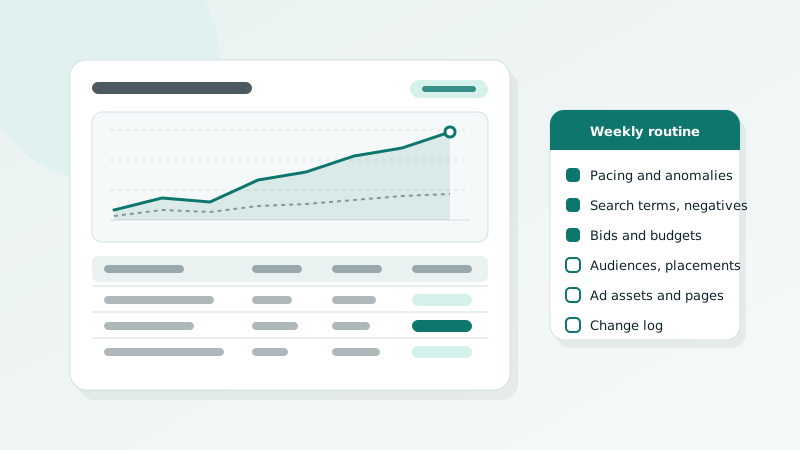
A Microsoft Advertising account produces more reports than anyone can read. The job is not to read them all. It is to know which few answer the questions that matter, to look at them on a schedule, and to act on what they say. Here is the reporting frame we use, the weekly routine that comes out of it, and the warning signs that the data itself has gone wrong.
Set the frame before you open a report
Every number needs a reference point. Before the account launched, you should have agreed on a target cost per acquisition or return on ad spend based on your economics. Compare against that first, then against the previous period, and against the same period last year if you have it. Account for conversion lag: a week that looks poor on Monday often fills in as delayed conversions arrive, especially for leads that close offline and are imported later.
Decide which attribution view you are using and stick to it, so that week over week comparisons mean something. Switching between views to find the one that looks best is not analysis.
The reports that matter
- Campaign performance segmented by network. Bing and partner search, the Audience Network and Copilot placements behave differently. A blended number hides problems.
- Search term report. The single most valuable view in the account. It shows what people actually typed, which keyword matched, and what happened next.
- Auction insights. Who is competing with you, how often they outrank you, and whether a new entrant explains a cost change.
- Keyword report with quality score components: expected click-through rate, ad relevance and landing page experience.
- Audience report. How in-market, remarketing and LinkedIn profile segments perform as targets or as bid adjustments.
- Website URL report for Audience Network placements.
- Device, location and time of day segments.
- Conversions by goal, to see which actions are actually driving the totals.
- Change history, to connect any shift in results to what was changed and when.
A weekly optimization routine
Done in this order, the routine fits in about an hour for a mid-sized account. Skipping steps is how accounts drift.
- Pacing and anomalies. Spend against budget, conversions against the weekly target, anything that moved more than usual. Check for disapproved ads and confirm the UET tag status.
- Search terms. Add negatives for irrelevant queries at the right level: ad group, campaign or shared list. Promote converting queries to keywords. Note new intent patterns that deserve their own landing page.
- Bids and targets. For manual campaigns, adjust bids where cost per conversion is far from target. For automated strategies, adjust targets gradually and only when there is enough data to justify it.
- Budgets. Move budget from campaigns missing target to campaigns beating it, especially those limited by budget with a healthy cost per conversion.
- Audiences and placements. Review LinkedIn profile and in-market segments and adjust bids up or down. Exclude Audience Network placements with meaningful spend and no conversions over a sensible window.
- Ads and pages. Check asset performance labels on responsive search ads and replace the low performers. Open Clarity for the top landing page and watch a handful of recordings from the week.
- Change log. Write down what you changed and why. Next week's question about what happened starts here.
Reading quality score and impression share correctly
Quality score is a diagnostic, not a goal. Low expected click-through rate points to ad copy or keyword relevance. Low ad relevance points to ad groups that mix intents. Low landing page experience points to the page itself. Fix the component, not the score, and expect the score to follow slowly.
Impression share tells you where growth would come from. Share lost to budget means money. Share lost to rank means bids or quality. Chasing impression share on terms that do not convert is an expensive hobby, so read it next to cost per conversion, never alone.
Signs the tracking is lying
Reports are only as good as the conversion data behind them. Watch for these patterns.
- A conversion rate that is unrealistically high or suddenly doubles. Often a goal firing on every pageview, or the same action counted twice.
- Conversions dropping to zero while clicks continue. Usually a tag removed by a site update, a consent change or a broken thank-you page.
- UET tag status not receiving traffic, or a goal with no recent conversions when the business says leads are arriving.
- Totals that do not reconcile with your CRM or order system within a reasonable margin once conversion lag has passed.
- Duplicate goals counting the same action, or imported offline conversions arriving late and reshaping weeks you already judged.
Reconcile platform conversions with your own records every month. When they diverge, stop optimizing until you know why. Optimizing toward a broken signal makes the account worse with great confidence.
Monthly questions on top of the weekly routine
Once a month, step back from the weekly loop and ask a different set of questions. Is cost per acquisition trending toward target, or just fluctuating around it? Which campaigns deserve more budget next month, and which should be cut? What did the tests teach us, and what will we test next? Are there seasonal changes ahead that the campaigns should prepare for now? Is the feed, the landing page or the offer the bottleneck at this point, rather than the bids?
Write the answers into a one-page roadmap and bring it to the next meeting. Accounts improve when both rhythms happen on schedule: the weekly routine keeps the account clean, and the monthly questions keep it pointed at the right target.
Key takeaways
- Judge every number against the target you set from your economics, then against prior periods, with conversion lag in mind.
- The search term report, network-segmented performance and conversions by goal answer most questions.
- A seven step weekly routine, finished with a change log, keeps the account from drifting.
- Fix quality score components rather than chasing the score, and read impression share next to cost per conversion.
- Reconcile conversions with your own records monthly, and stop optimizing when the data cannot be trusted.
If you would rather receive this as a weekly dashboard with written commentary and a thirty minute call, tell us about your account and we will show you what our reporting looks like.